How Does Work?

Retention of any compound in HPLC is affected by the values of chromatographic conditions such as: Organic solvent %, Column temperature, Buffer pH, gradient time…etc.
Each of these conditions affects retention time of any compound through published model equations (either empirical or mechanistic).
uses the data resulting from few runs performed at different values of one or two method conditions to solve these equations for each compound.
After that apply these solved equations to all proposed values of the studied condition(s) to predict retention times of each compound as well as resolution between peaks.
The predicted resolution values are plotted as resolution maps (either 1D or 2D).
This map is interactive and produce the chromatogram corresponding to the point you click on.

CHROMOCAD

features

1. Basic mode: Optimization of one chromatographic factor
2. Advanced mode: simultaneous optimization of two different parameters
3. Simulation of instrumental and hardware changes
4. Data storage
5. Results Output
6. How to use software

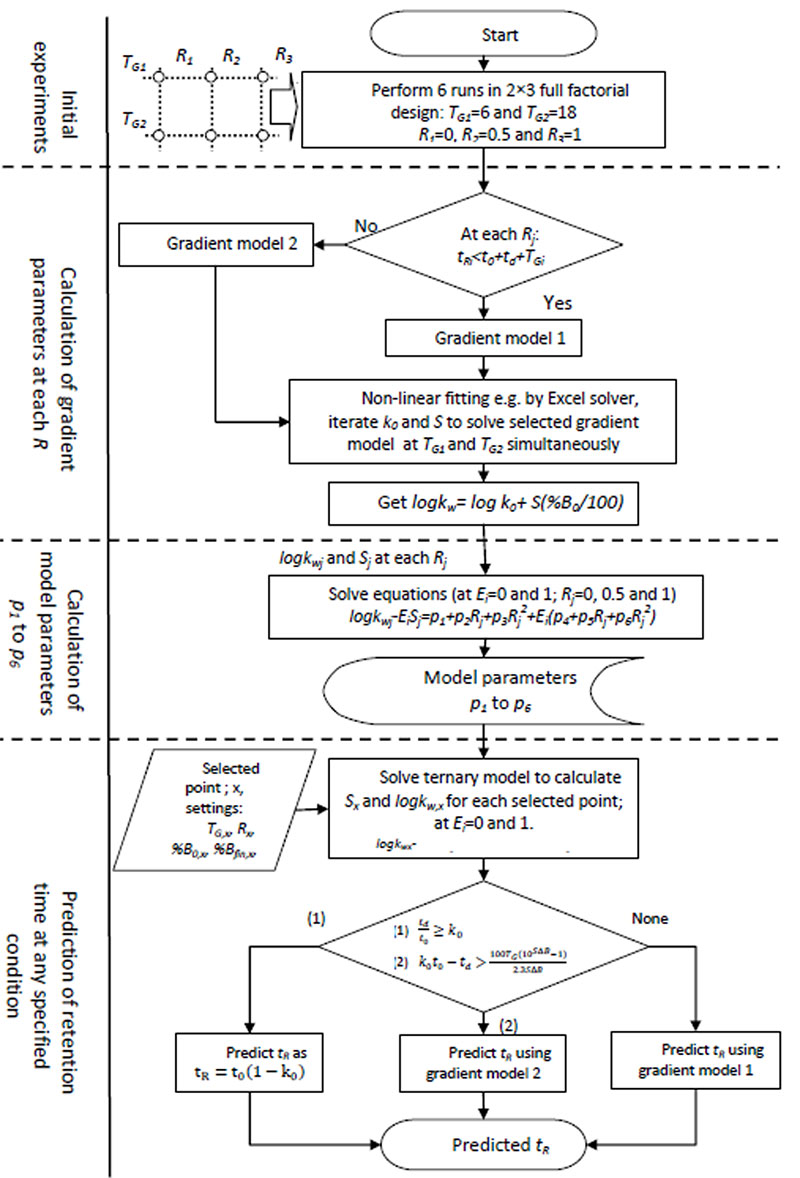
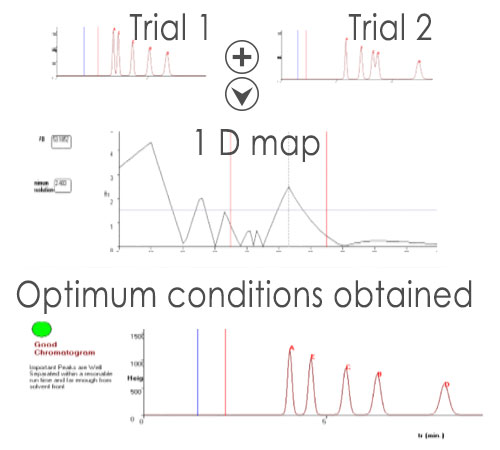
Only two or three initial runs are sufficient to predict all possible separations within one tested parameter.

Basic mode: Optimization of one chromatographic factor

Basic mode: Optimization of one chromatographic factor
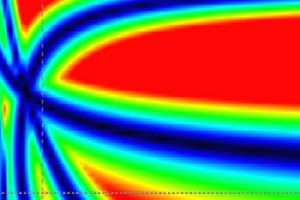
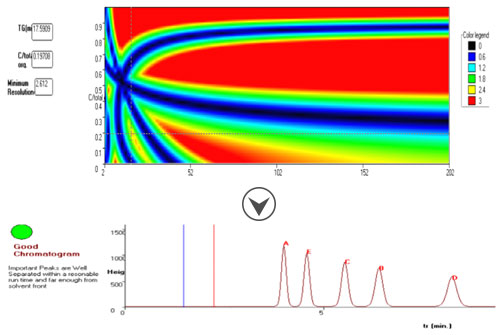
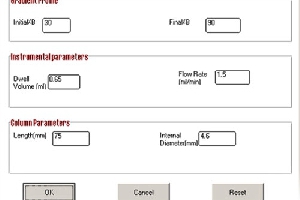
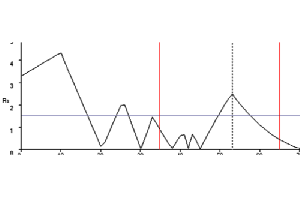
Chromocad enables optimization of one factor (such as organic solvent %, pH, temperature,...). Optimization requires only 2-3 initial experimental runs differing in the value of the selected factor for optimization. Chromocad help files provides assisstance in planning the initial experiments. After performing the initial experiments, the retention data are entered into the software interface. This will result into a plot of minimum resolution between peaks as a function of the optmized method parameter. From this plot you can select the optimum condition. Chromocad will predict the chromatogram at the selected condition.

Chromacad supports the optimization of the following chromatographic conditions in 1D mode:

-- Organic solvent % (%B) in Reversed Phase Chromatography.
-- pH of buffer or mobile phase at constant ionic strength- both Henderson-Hazelbach or polynomial models.
-- Temperature.
-- Ion paring agent concentration or amine modifier at constant ionic strength.
-- Buffer concentration in cyano or amino columns.
-- Gradient time.
-- Ternary solvent ratio (ratio of the third organic solvent to the ratio of total organic solvent) .


Few initial runs enable prediction of 2D contour map of minimum resolution between peaks as a function of two different chromatographic parameters.

Advanced mode: simultaneous optimization of two different parameters

Advanced mode: simultaneous optimization of two different parameters
Chromocad enables simultaneous optimization of two different chromatographic parameters (e.g. % organic solvent and column temperature). Chromocad will need only 4-9 initial runs. Chromocad help files will aid you to plan these trials. After performing the trials and entering their data in Chromocad, you will obtain a 2D contour map with X and Y axes represent the optimized two parameters. The color of each point in the map represents minimum resolution between peaks as indicated by color code legand. You can pick the optimum point by visual inspection of the map and Chrmocad will predict the chromatogram of this optimum conditions.

Chromcad supports the following combinations of chromatographic parameters in 2D mode:

-- %B and pH
-- %B and Temperature
-- pH and Temperature
-- pH and Ion pairing agent concentration.
-- Gradient time and Temperature.
-- Gradient time and pH both Henderson-Hazelbach or polynomial models.
-- %B and Ternary solvent ratio.
-- Gradient time and Ternary solvent ratio.


Method transfer option box enables different scenarios of instrumental and hardware changes as well as gradient parameters changes.

Simulation of instrumental and hardware changes

Simulation of instrumental and hardware changes

Chromocad can simulate the following changes:
--Use of columns with different dimensions
--transfer of gradient methods between HPLC systems with different dwell volume.
--Changes to flow rate.
chaanges to caalculaated gradient parameters (initial and final orgaanic solvent %)
--switching from gradient elution into isocratic elution to evaluate feasibility of isocratic separation.


You can store, open and modify your prediction files as you want.

Data storage

Data storage
-- Chromocad is capable of saving and opening prediction files in special files.
-- Also Chromocad can store additional useful data such as: column type, phase type, solvents, additives, constant pH and constant temperature.


User friendly displays and printouts with custom options.

Results Output

Results Output
Prediction results could be displayed as the following:
Resolution maps:
-- 1D resolution map for one-dimension models.
-- 2D resolution maps for two dimension models
2D Resolution map colors could be adjusted for their magnitudes. Options of 2D resolution map modes:
----Colored (rainbow)
----white in black
----Black in white
Chromatogram
to display the chromatograms resulting from optimum conditions or any selected conditions by clicking on any point in resolution map.
-- Data table:
to display the data of the resulting chromatogram such as peaks retention times, areas, heights, capacities ,efficiencies and resolution.

Printout:
you can print either:
--Map + Chromatogram+ Table
--Map only
--Chromatogram with table


Help files and suggested trial settings are available.

How to use software

How to use software

Help files with full details of the basics of method development using Chromocad are available. suggestions of experimental trials are also provided.